This set of plots and statistics summarizes key structural and spatial characteristics of the forest canopy derived from a LiDAR data analysis. The outputs include a statistics summary, for total tree count, scene area, and tree density. There are also many charts and maps being created to describe the scanned area.
These outputs support ecological assessment, forest inventory, and landscape structure analysis by integrating 3D data into interpretable visualizations and summary metrics.
Data Visualization Maps
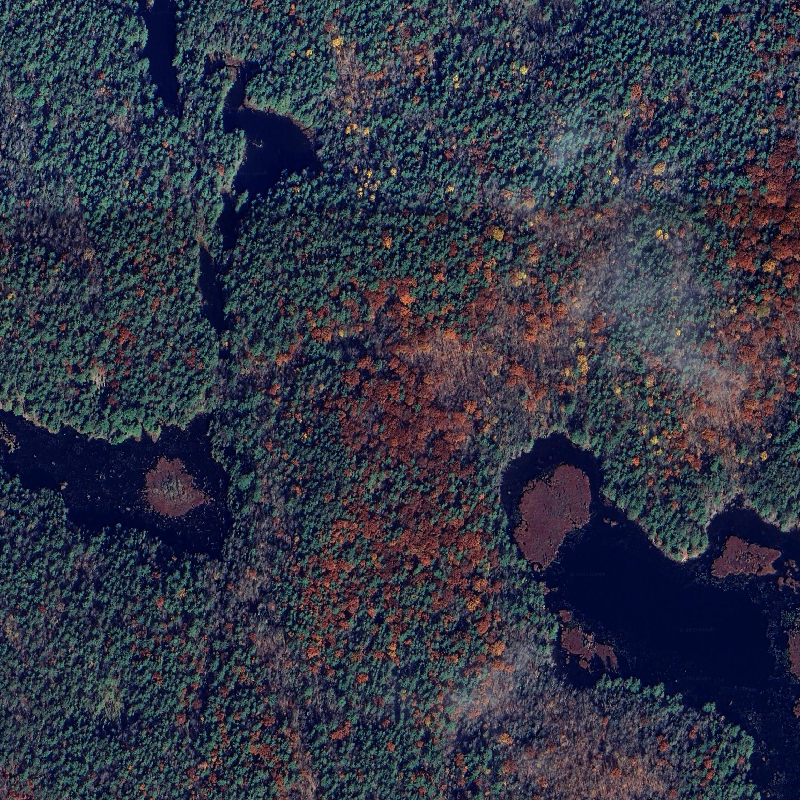
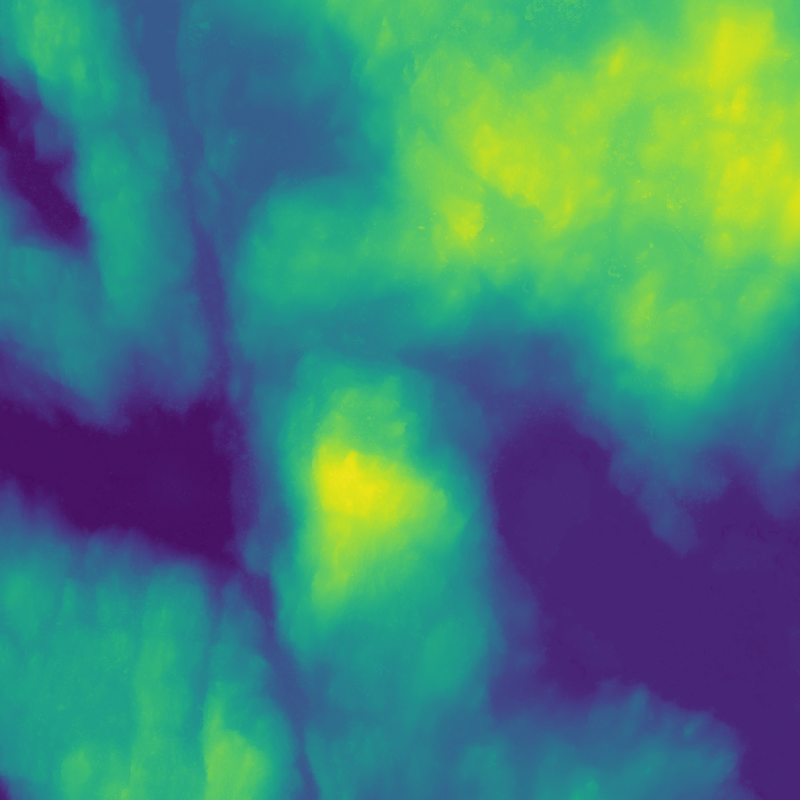
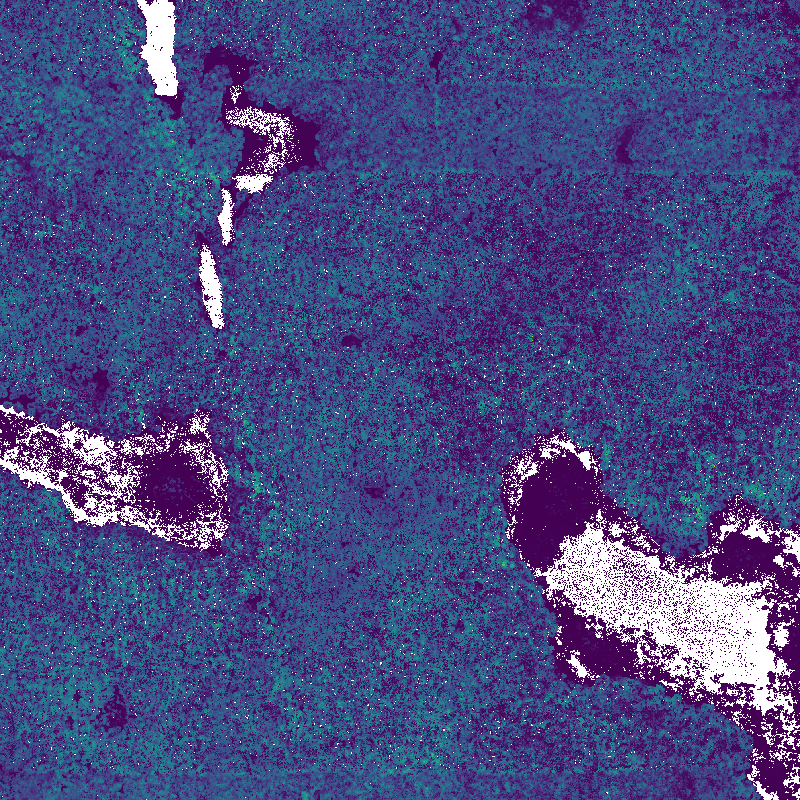
Imagery & Elevation
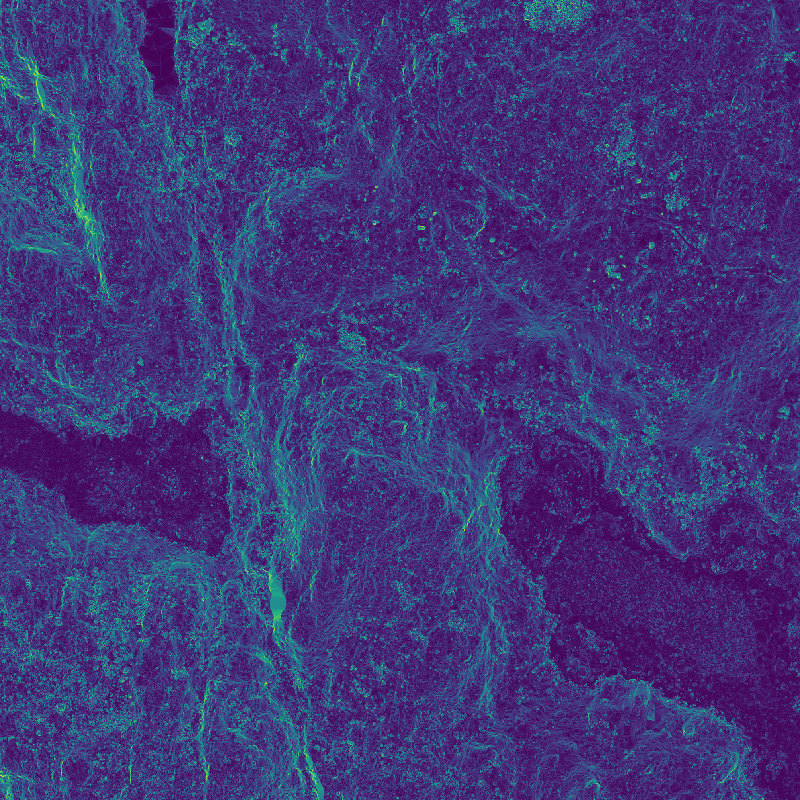
Imagery & Slope
Elevation & Slope
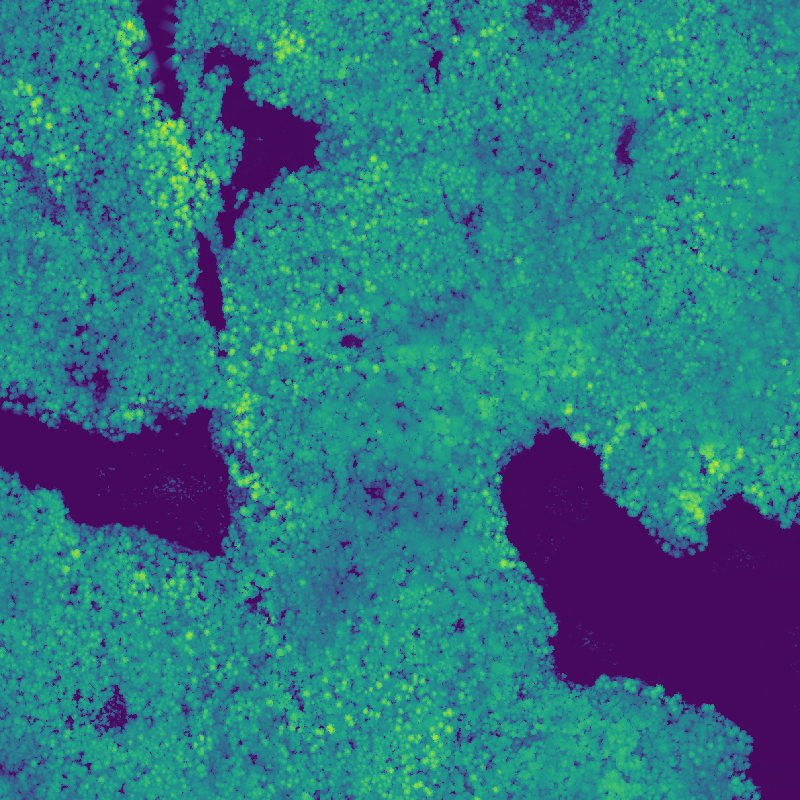
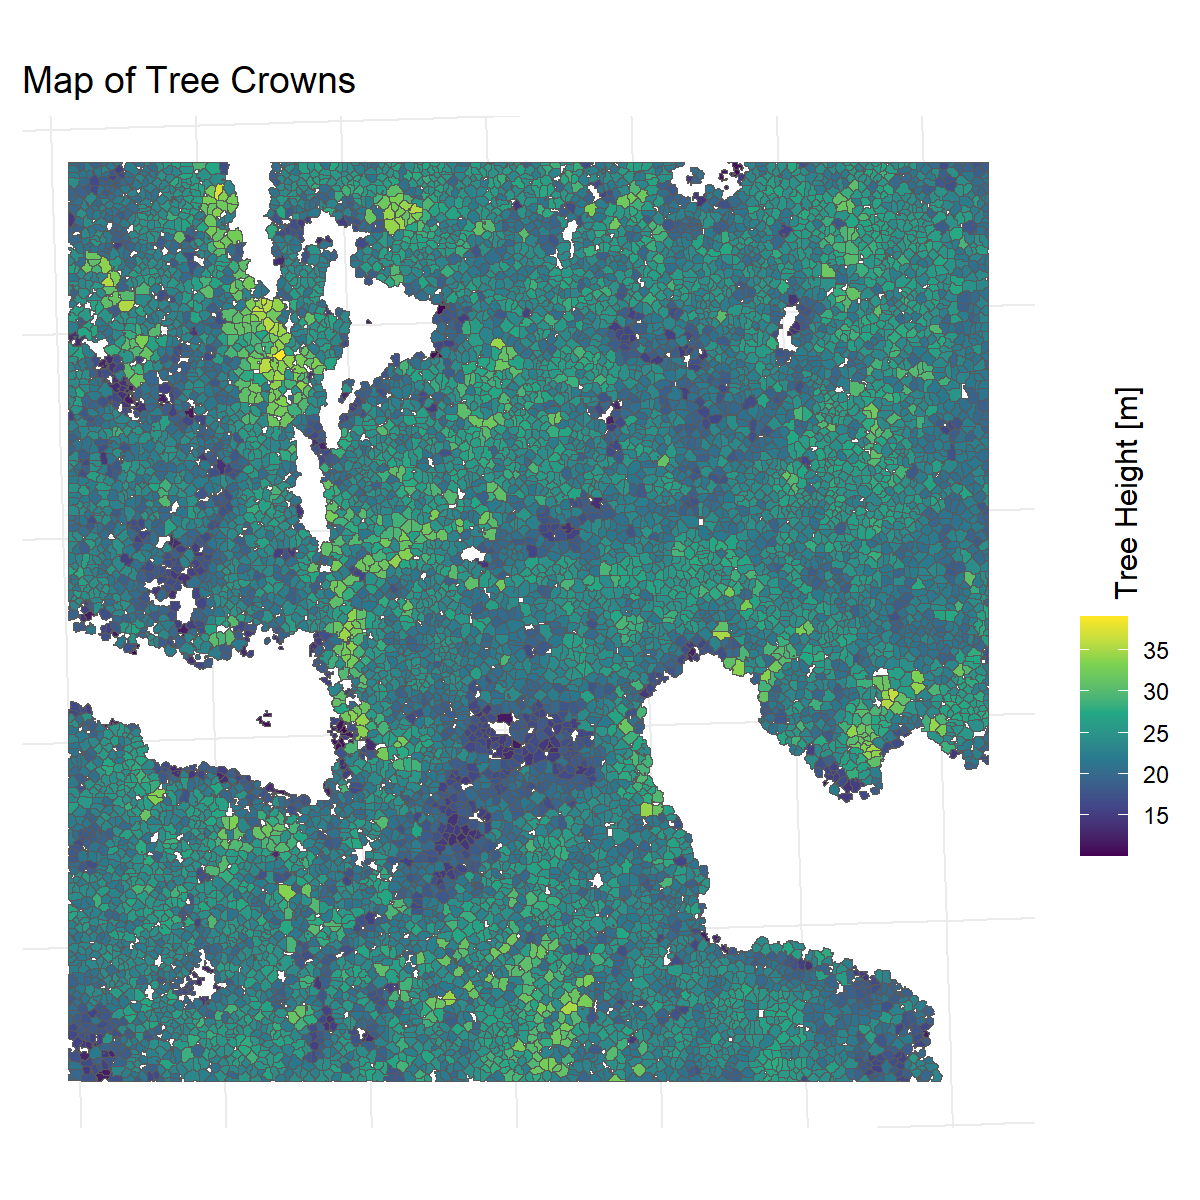
Imagery & Tree Height
Imagery & Vertical Vegetation Complexity
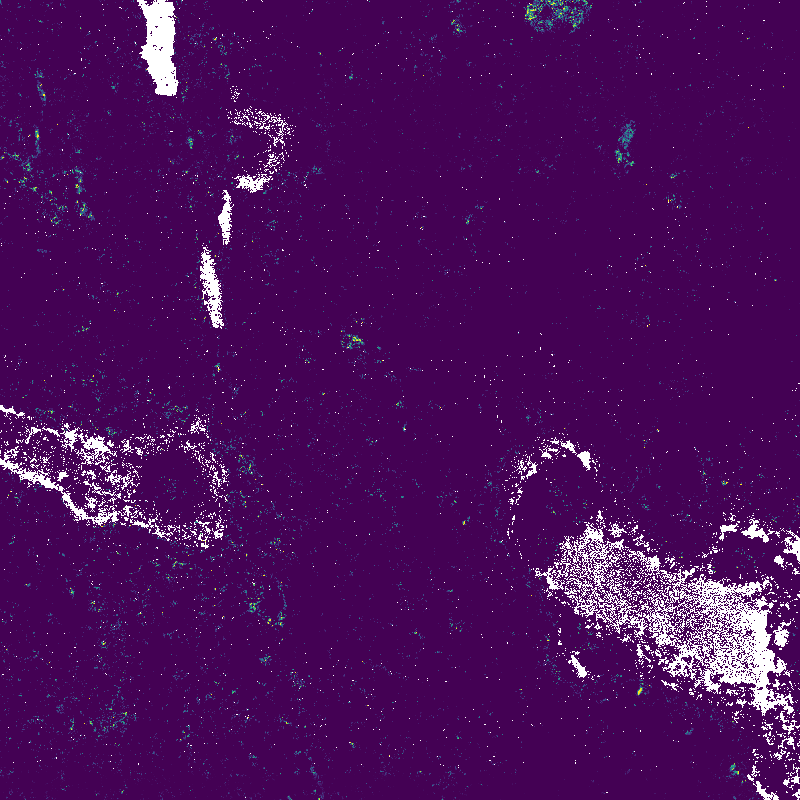
Imagery & Understory Density
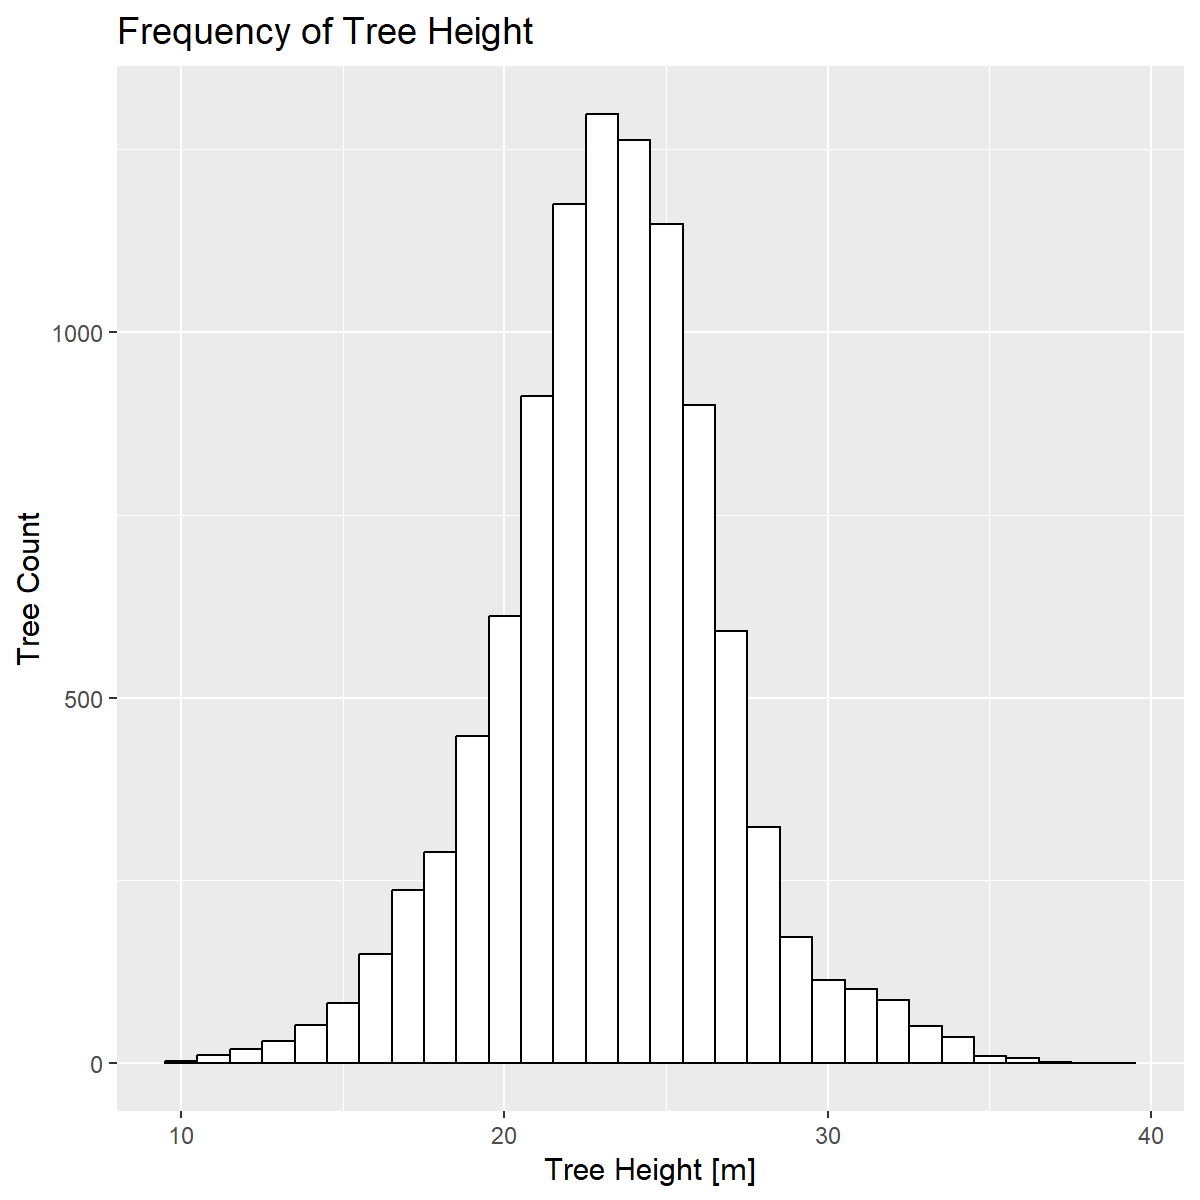
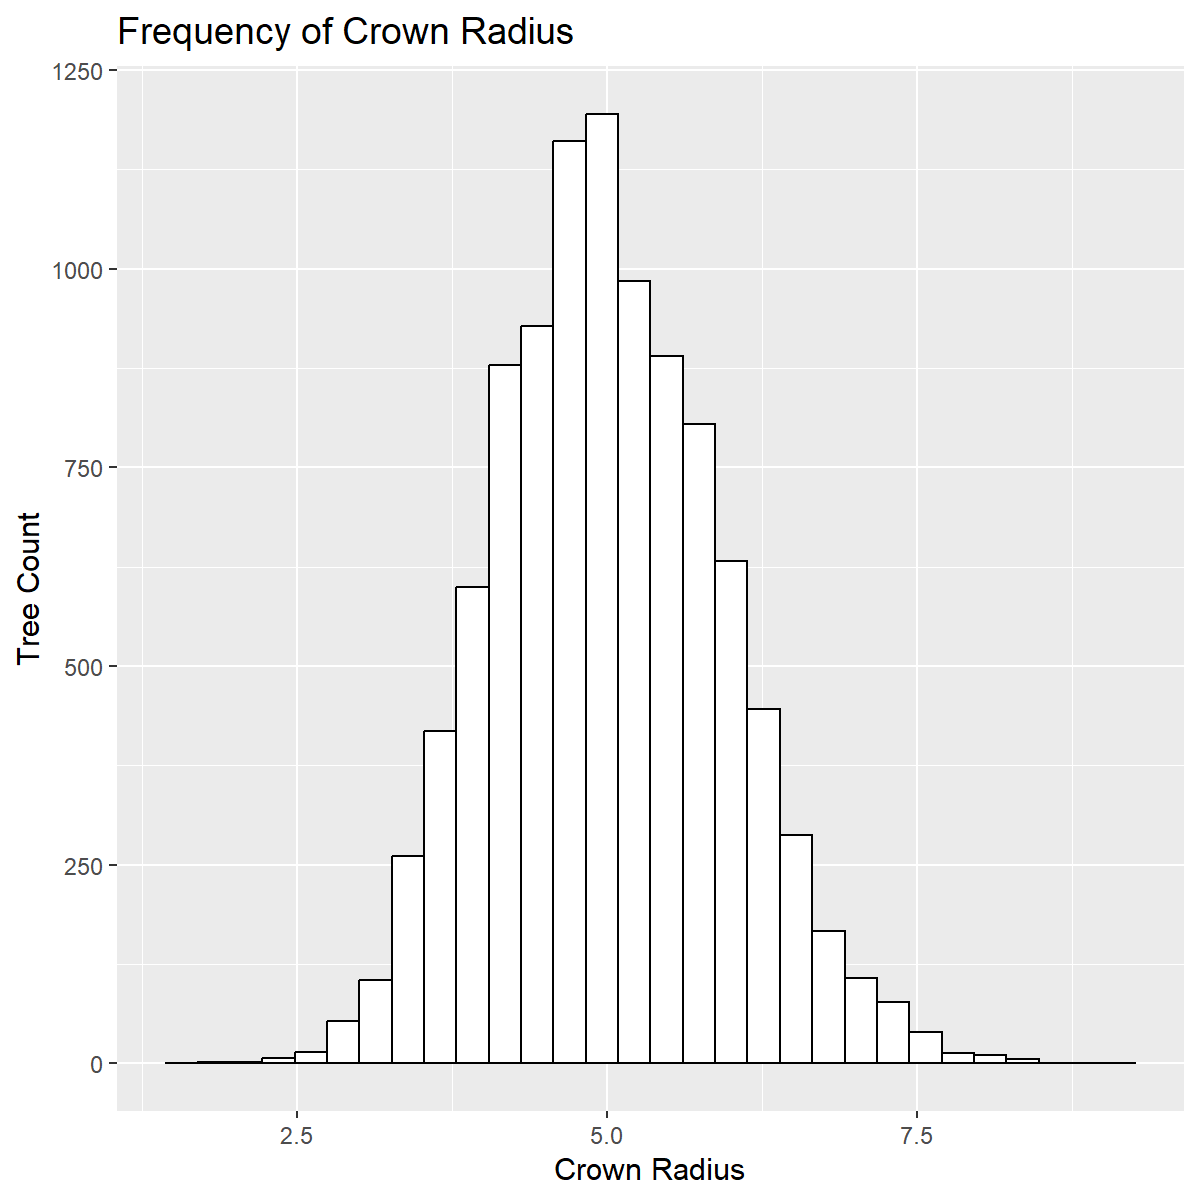
Histograms & Charts
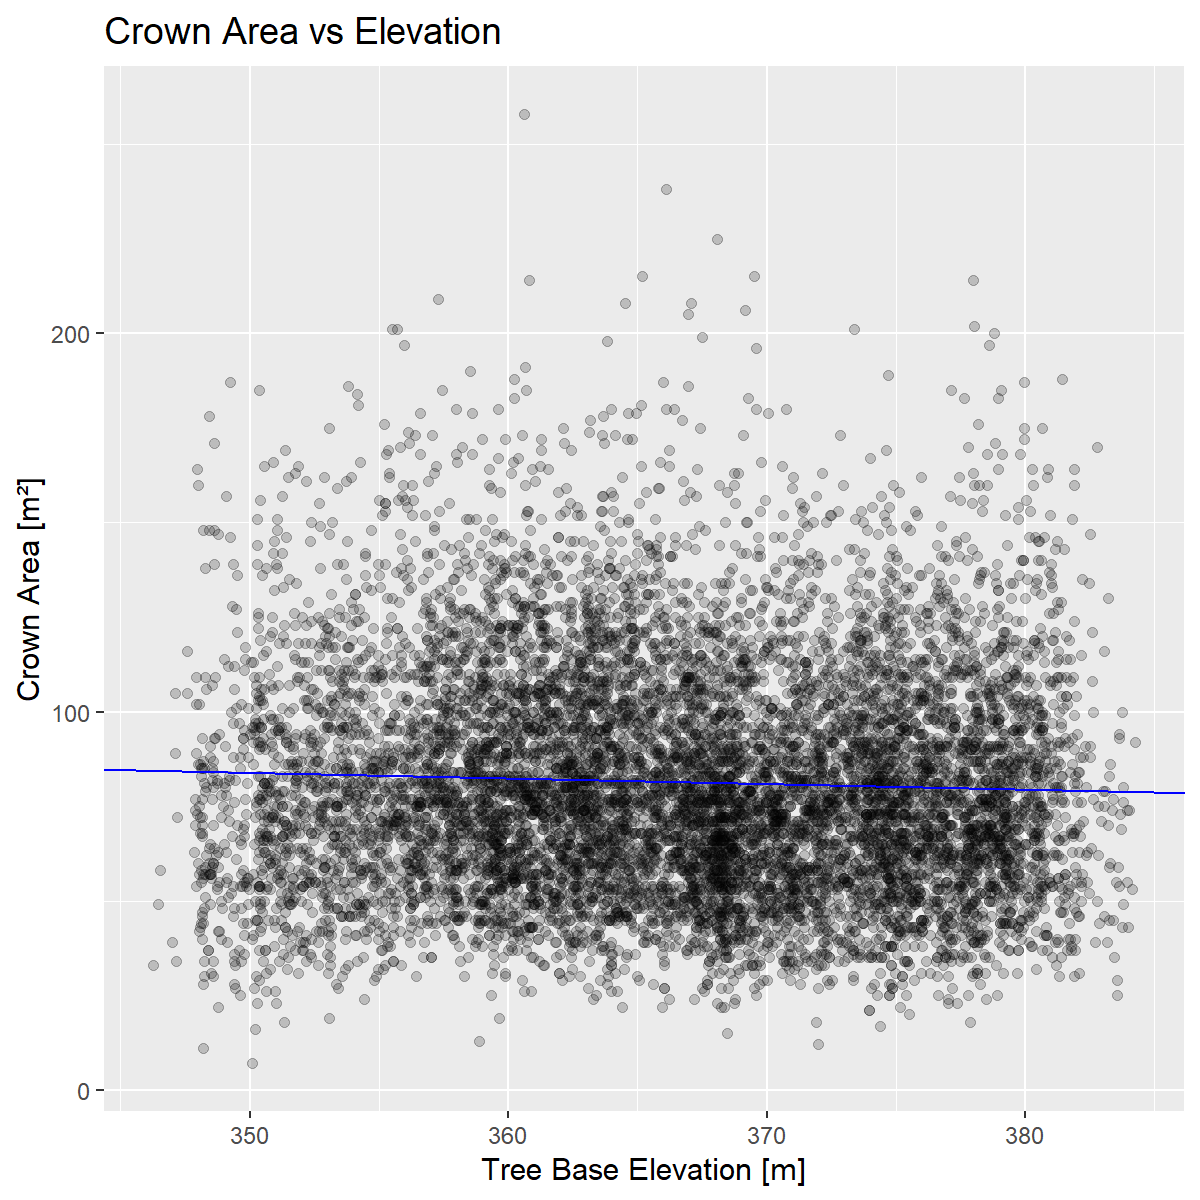
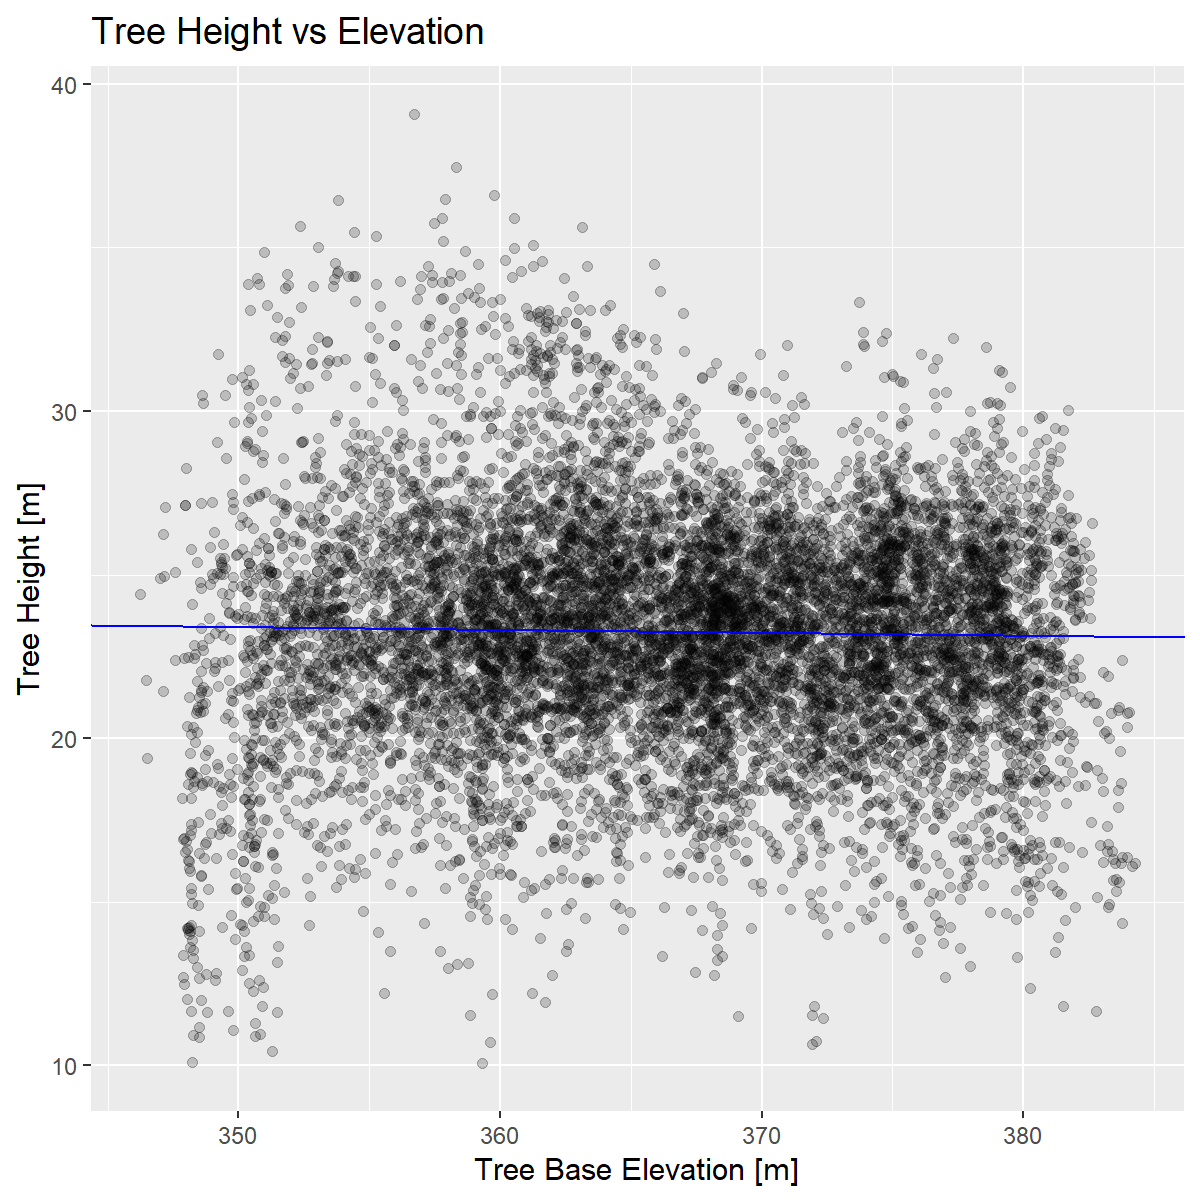
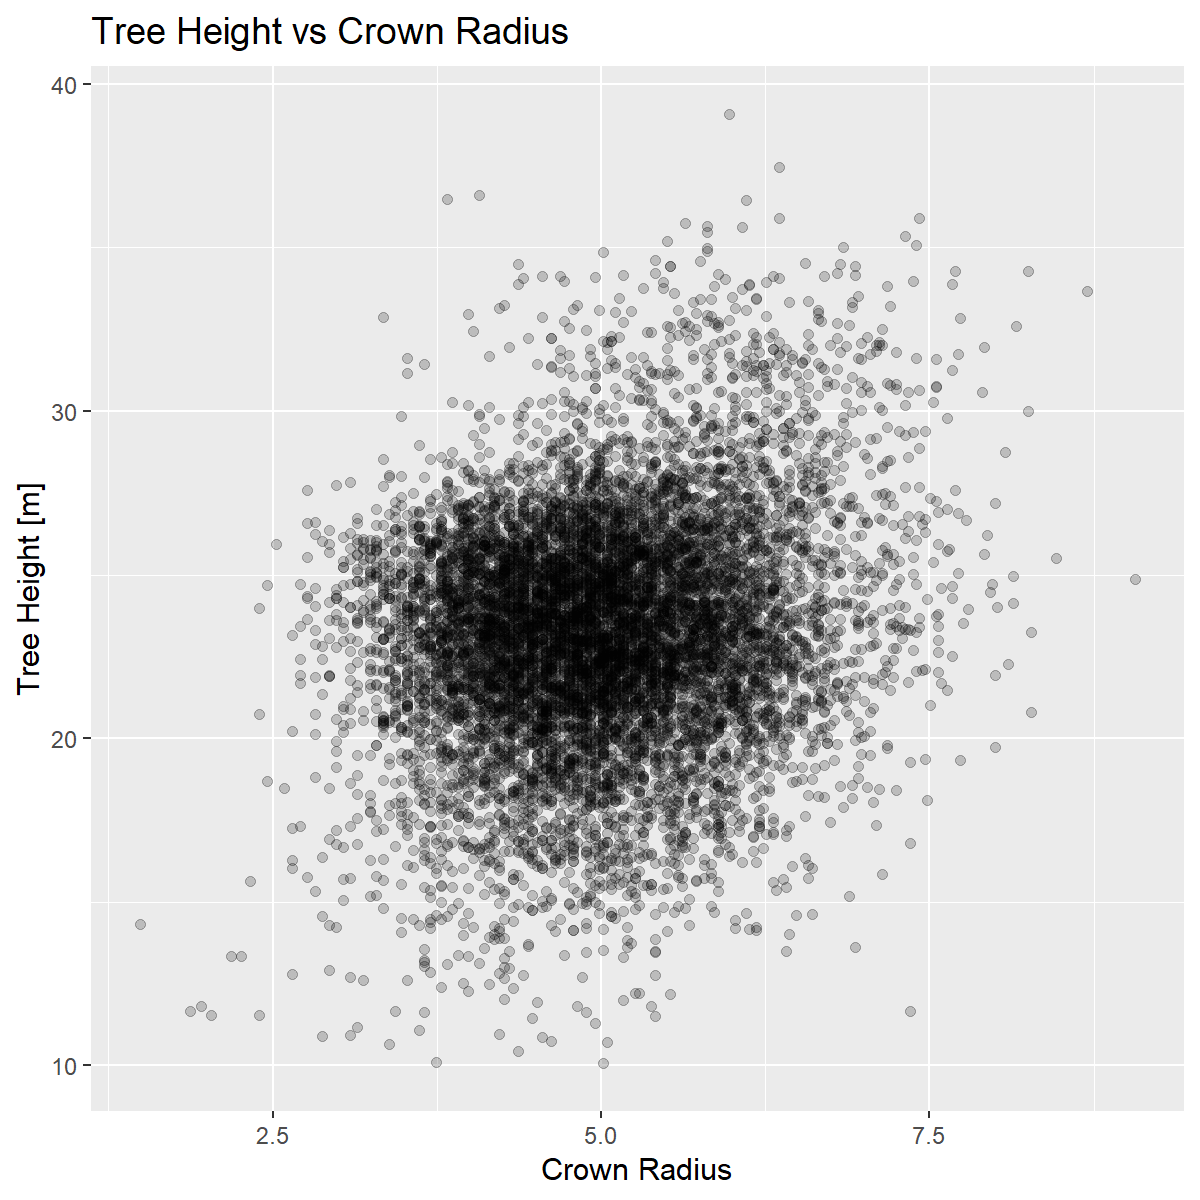
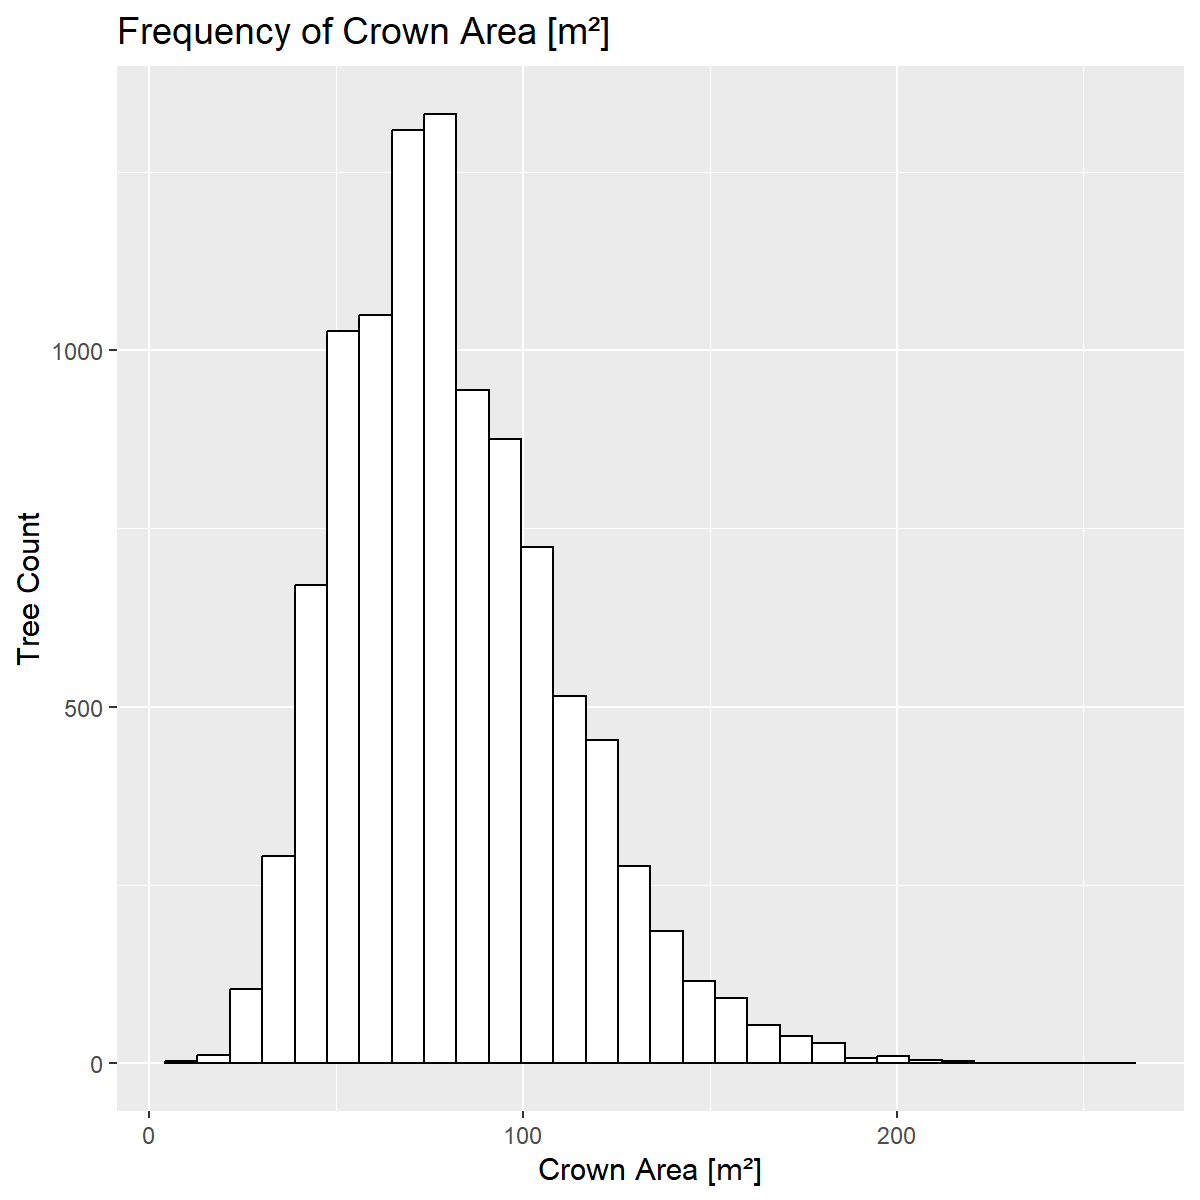
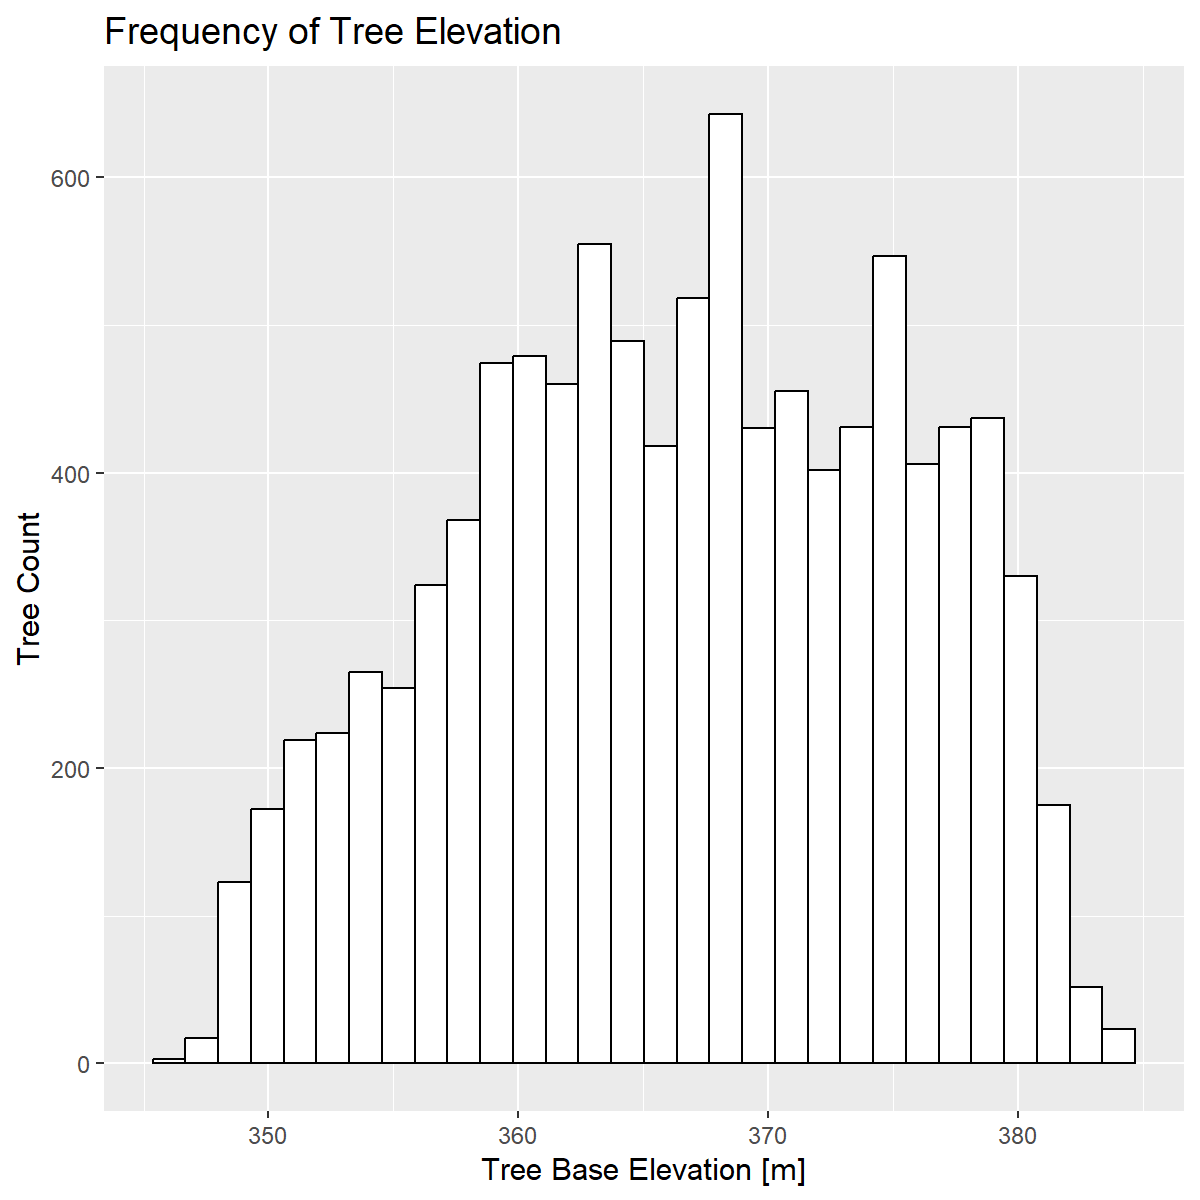
Descriptive histograms of the frequency distributions of tree crown radius, height, base elevation, and crown area provide insights into overall forest structure.
Statistical Summary
Total Trees: 10092
Area in m²: 999996
Area in Hectares: 99.9996
Area in Acres: 247.1044
Water Area in m²: 116376
Land Area in m²: 883620
Land Area in Hectares: 88.362
Land Area in Acres: 218.3473
Trees per Hectare (Land): 114.212
Trees per Acre (Land): 46.21995
Send us a message!
Don’t hesitate to reach out with the contact information below, or send a message using the form